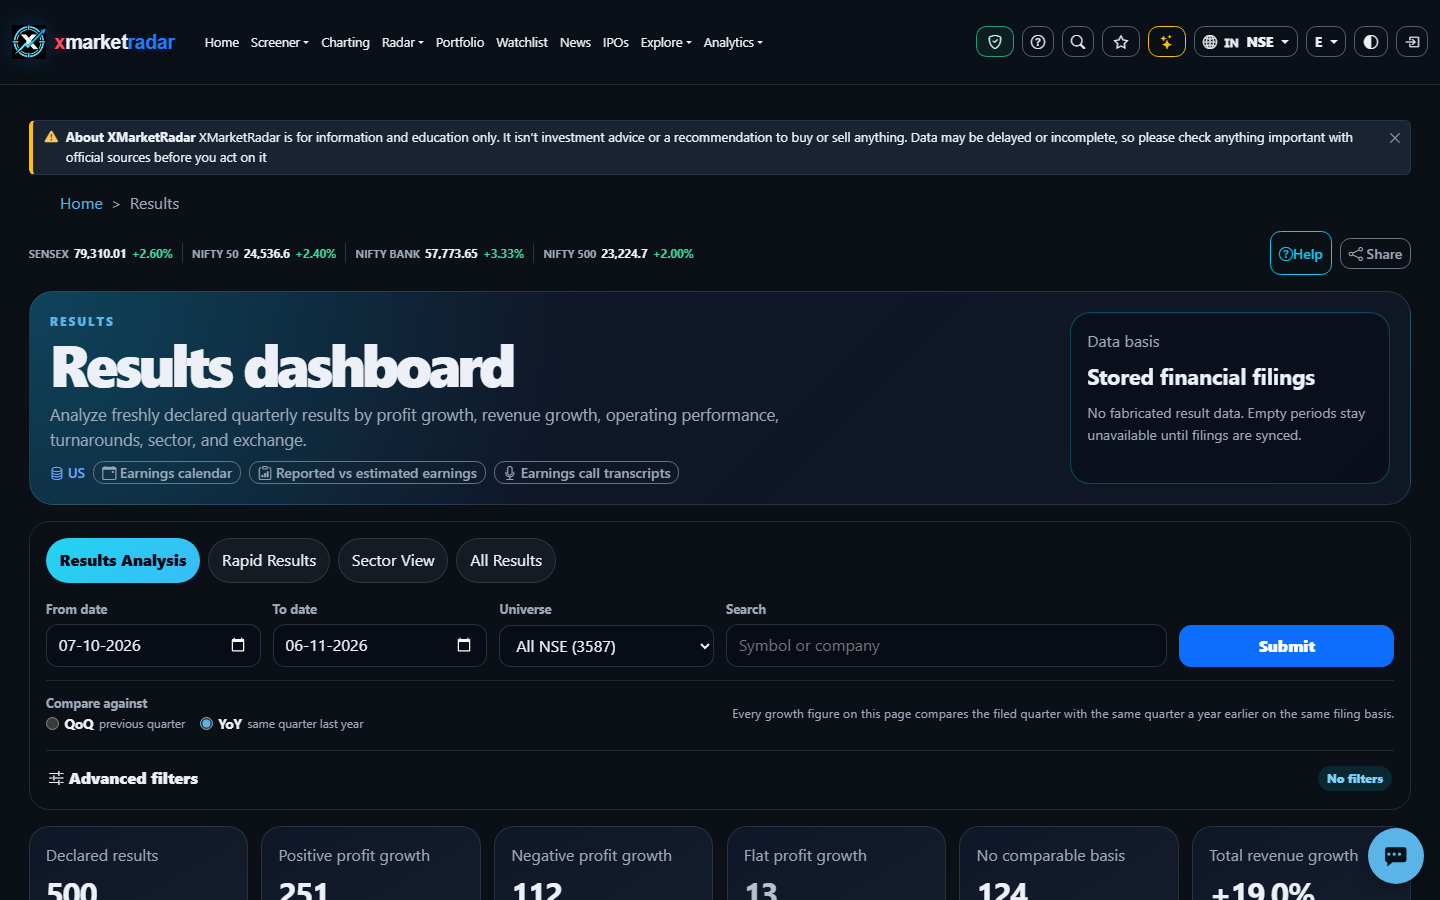
XMarketRadar Results dashboard with date range, universe, comparison basis and result counts. Market values shown belong to the capture time and may no longer be current. Captured 6 November 2026.
Plain-language meaning
Read the Results dashboard is a source-backed research workflow for one exact exchange listing or a clearly stated market scope. It describes available evidence and never creates a recommendation or trade instruction.
The Results dashboard analyses freshly declared quarterly filings through Results Analysis, Rapid Results, Sector View and All Results. Rapid Results switches among latest, best, worst, positive-turnaround and negative-turnaround views, with same-basis QoQ or YoY comparisons performed locally after one load.
1. Confirm exchange and instrument. 2. Select the intended period or scope. 3. Read the as-of time, unit and native currency. 4. Inspect available rows. 5. Open supporting evidence. 6. Treat missing inputs as unavailable. 7. Save or compare only like-for-like evidence.
Illustrative only: a company moving from a net loss last year to a profit this quarter appears under Positive Turnaround with the two filed values; it does not show a fabricated multi-thousand-percent growth rate from the loss base The example is not a live quote, forecast or expected result.
Higher, lower, positive and negative values retain the definition of the displayed field and period. A genuine zero is evidence; unavailable is missing evidence. No single field determines whether an instrument is suitable.
A genuine source-reported or calculated zero is displayed as 0. Unavailable (—) means verified evidence is absent, unsupported, stale or not computable; it is never silently changed to zero.
Coverage, reporting periods, stale observations, corporate actions, methodology changes and small samples can limit comparison. Never combine unlike currencies, scales, sessions or instruments without an explicit compatible basis.
Comparisons require a matching consolidated, standalone or unknown filing basis within the expected quarter window. Missing periods remain unavailable, and consensus estimates stay unavailable until a licensed estimates feed exists.
Continue with Data sources and freshness, Exchange and universe scope, and the linked A-to-Z concepts. Verify the current primary source before relying on time-sensitive evidence.
This guide is descriptive education, not investment advice, a prediction, a recommendation, or an instruction to buy, sell, rebalance or place an order.
Educational information only; not investment advice or an order service.