
Contents · 46 / 58
Build reports in XMarket Studio
Updated 31 October 2026 · 3 min read · 14 Contents
Plain-language meaning
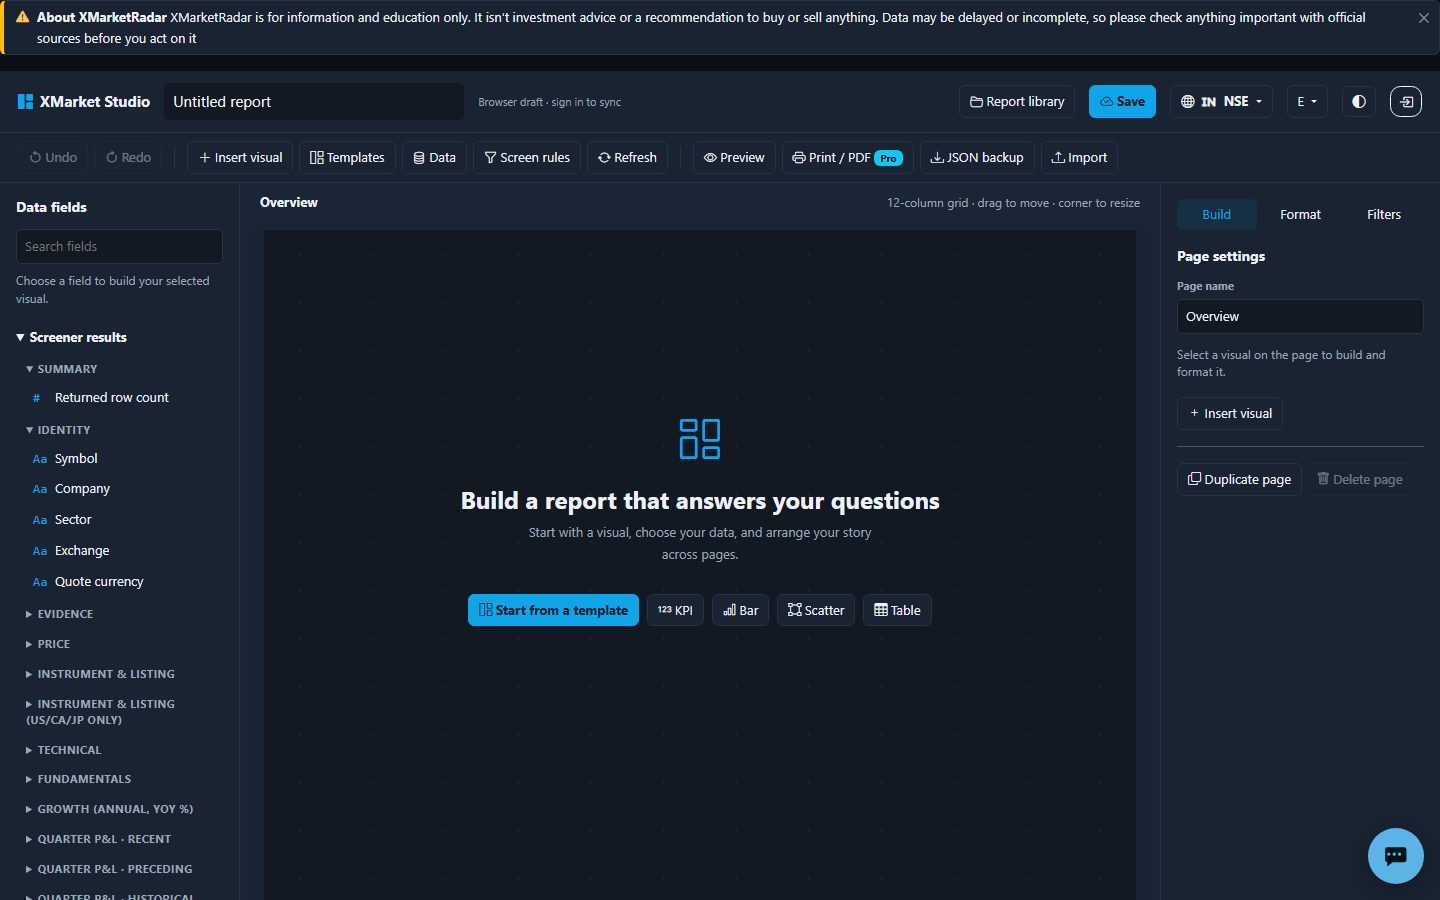
XMarket Studio is a report editor: you build multi-page reports on a 12-column canvas from KPI, chart, scatter, table and text visuals fed by screener rules, then print or save them as PDF from the browser.
Why it is useful #
It turns a screen into a presentable, repeatable report with your own layout and commentary, using the same fields and rules as the screener.
Where it appears and the workflow #
Open Studio (/studio or /{exchange}/studio). Start from one of six templates — Market pulse, Sector deep dive, Value vs quality, Momentum tracker, Dividend income or Growth leaders — or a blank report, which starts with the rule Market Cap > 0. Add pages and visuals, set each visual's rule and fields, and arrange them on the grid. Save the report to your account when signed in, or keep a JSON backup.
Calculation or source #
Visuals run the screener against stored market data with the fields you choose; a visual can request only the fields it plots, which keeps large exchanges fast. Printing uses the browser's print dialog, so Save as PDF produces the file; it is separate from the server-generated Download PDF reports.
Prerequisites, inputs, period and unit #
Printing requires the standard-reports entitlement. Templates use Free-tier fields only; Pro or Max fields follow the screener's plan rules. Values keep each listing's native currency and as-of date.
Worked example #
Illustrative only: the Value vs quality template plots P/E against ROE for an exchange's listings with a table of the top rows. Changing the exchange rebuilds every visual for that market.
What high and low mean #
Within a visual, high and low follow each field's definition; the report itself does not score listings.
Positive, negative and zero #
Signed fields keep their meaning; zero is a real value and missing values are shown as unavailable rather than zero.
Limitations and common mistakes #
Reports do not refresh or send themselves on a schedule; reopen and print them when you need a new copy. Browser print layout can differ slightly between browsers.
Market-specific differences #
Each report runs against one exchange at a time, with that market's currency and session dates.
Suggested next steps #
Open the Market pulse template, change the exchange, add one text block with your notes and print to PDF. Save it to your account and reopen it.
Educational use only #
This guide explains descriptive research evidence. It is not investment advice, a price prediction, a recommendation, a claim of predictive accuracy, or an instruction to buy, sell, rebalance or place an order.