
Contents · 28 / 58
Use XMarketRadar Radar
Updated 22 August 2026 · 4 min read · 14 Contents
Plain-language meaning
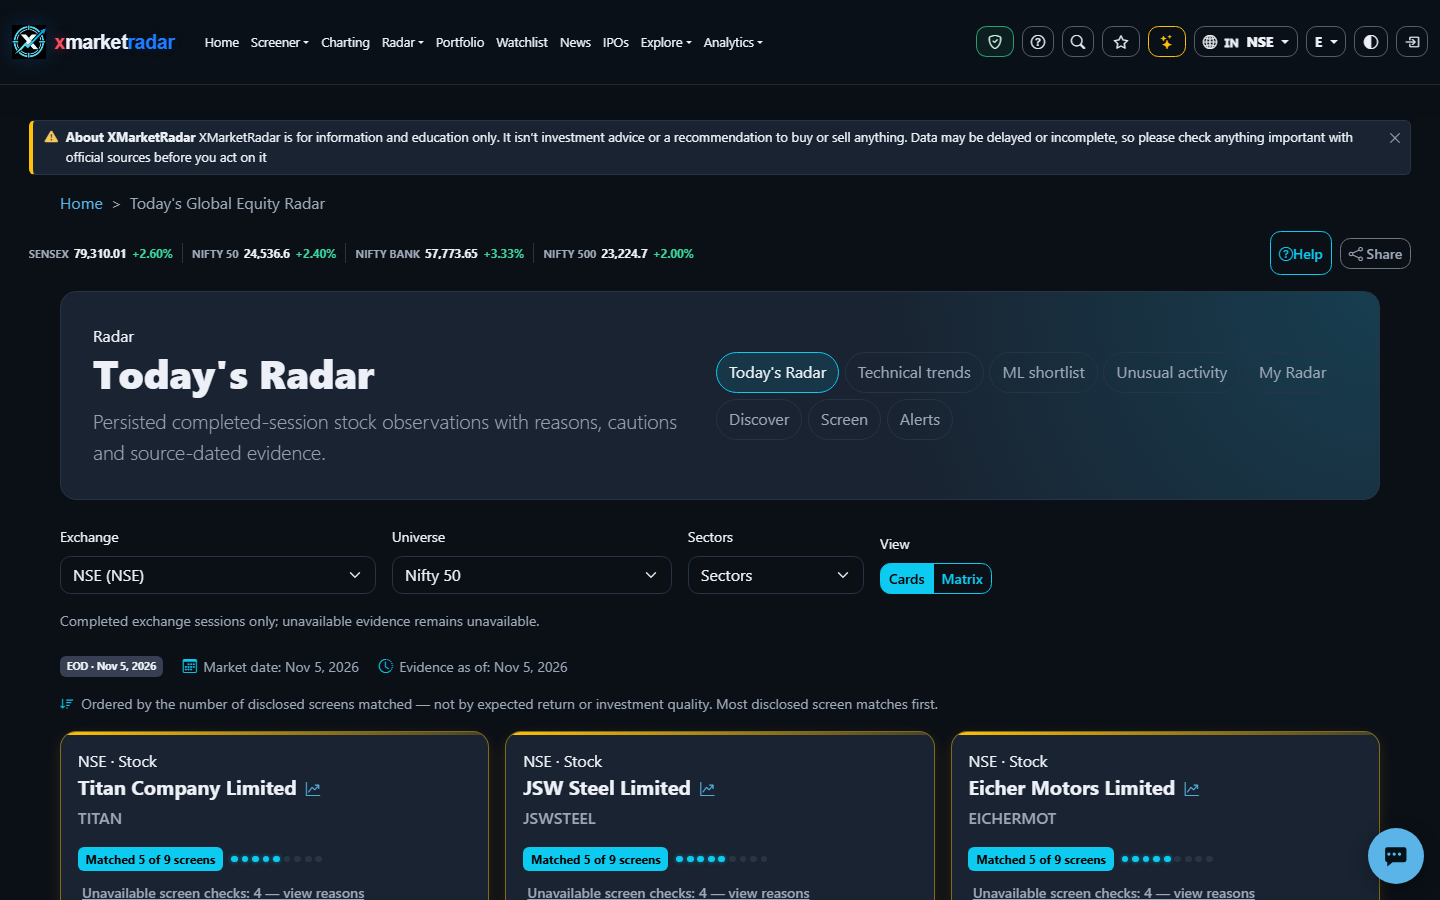
Radar is an exchange-scoped research workspace that groups listings by published evidence profiles and shows why each listing matched, did not match, or could not be evaluated. Tracking a listing in My Radar saves a research watch; it does not buy the security or create an order.
Why it is useful #
Radar helps you move from a broad exchange universe to inspectable evidence cards, technical trends and dated events without hiding the rule or unavailable inputs. Its profile count is a count of disclosed matches, not a quality score or forecast confidence.
Where it appears and the workflow #
Open Radar Today or Discover, choose the exchange and universe, then select a profile. Read the evidence date, source set and unavailable reasons before opening a listing. Use My Radar to track an exact listing, review material changes and archive it when it no longer belongs in your research queue. Technical Trends uses its own completed-session view; Unusual Activity is a separately gated advanced board.
Calculation or source #
Rule-based Radar reads persisted completed-session price, technical, filing, risk and event evidence under versioned profile policies. Snapshots and event history are built in background work and remain attached to the exact exchange listing. Optional ML or quantitative cards are additive evidence only and never change a rule-based match into a recommendation.
Prerequisites, inputs, period and unit #
Prerequisites are an enabled Radar exchange, an exact listing identity and sufficient current persisted evidence for the selected profile. Profile inputs retain their own periods, native currency or percentage unit, source and as-of date. Owner tracking and review actions require sign-in; plan limits can restrict how many assets are tracked without changing public evidence.
Worked example #
Illustrative only: a profile evaluates six required facts for one NASDAQ listing. Four match, one does not match and one is unavailable because history is too short. Radar reports those states separately; it does not convert the unavailable fact to zero or call the listing a four-out-of-six recommendation.
What high and low mean #
A higher match count means more published profile conditions currently match. It does not mean higher expected return. Trend strength describes disclosed technical criteria, while realized-risk labels describe historical peer context and never supply a bullish or bearish direction.
Positive, negative and zero #
Positive and negative values keep the meaning of their underlying metric. A zero count can be a genuine evaluated result, such as no current matched profiles. It is different from a profile or exchange that could not be evaluated, and neither state should be ranked as a neutral score.
Limitations and common mistakes #
Common mistakes are treating Radar as a buy list, adding profile counts as if the inputs were independent, comparing different exchanges or evidence dates, reading a continuing state as a fresh event, and assuming an absent ML card means a zero probability. Always open the underlying evidence and its method version.
Market-specific differences #
Rule-based Radar is configured for supported equity exchanges, but profile coverage and evidence depth vary by venue. Each listing retains its exchange, session calendar, source and native currency. A missing international universe never falls back to NSE, and crypto does not use the equity Radar workflow.
Suggested next steps #
Start with one exchange and one profile. Record the universe, evidence date and evaluated/matched/unavailable states; open two listings and verify every cited fact. Then track only the listings you intend to review and use the event history to distinguish a new change from a continuing condition.
Educational use only #
This guide explains descriptive research evidence. It is not investment advice, a price prediction, a recommendation, a claim of predictive accuracy, or an instruction to buy, sell, rebalance or place an order.