
Contents · 57 / 58
Use the Portfolio Action Center
Updated 6 November 2026 · 4 min read · 14 Contents
Plain-language meaning
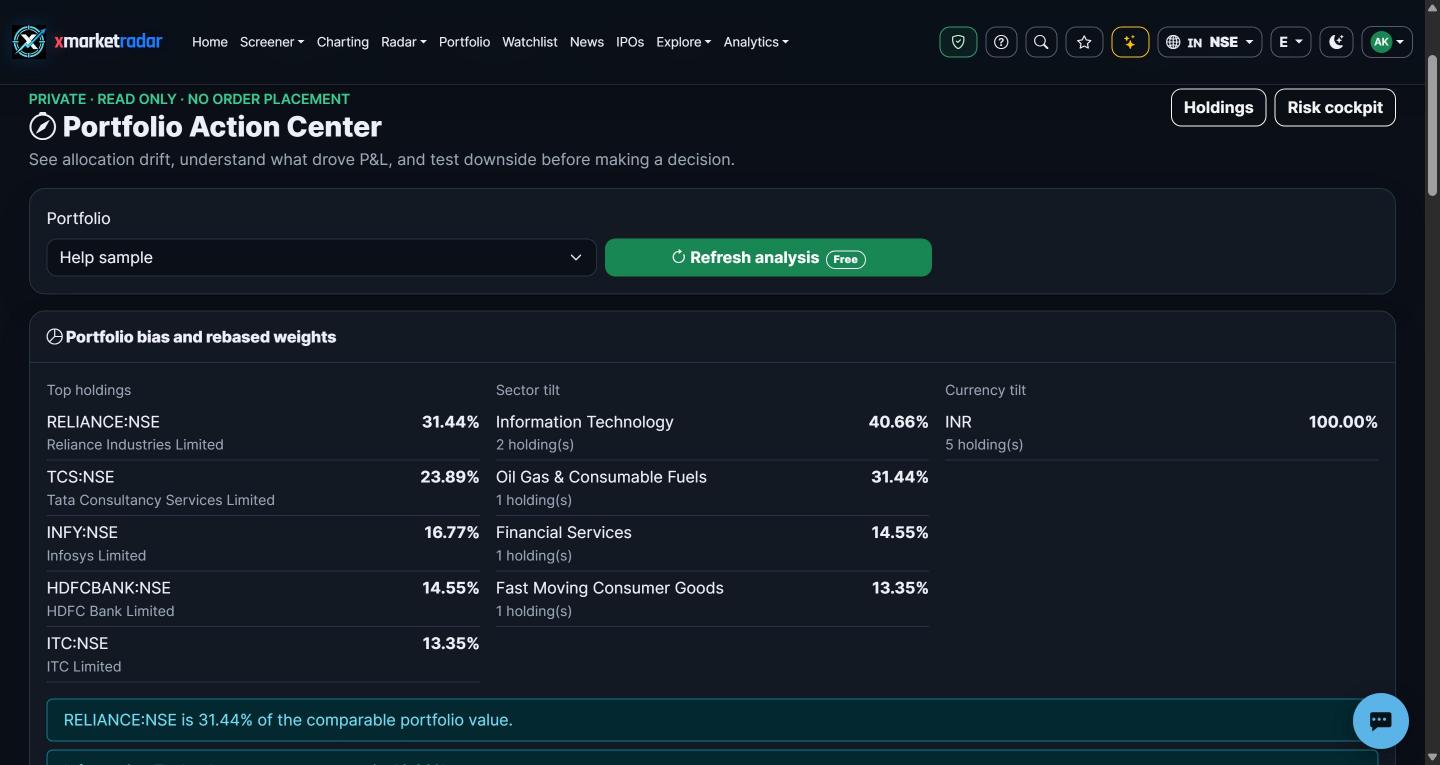
The Portfolio Action Center is a private, read-only workspace for one portfolio. It shows concentration (bias), target allocation and drift, current-position P&L attribution, a what-if stress scenario, a historical Scenario Explorer and a historical allocation lab. It never places orders.
Why it is useful #
It turns a list of holdings into the questions asked before a decision: how concentrated am I, how far am I from the weights I intended, what drove today's unrealized P&L, and what a stated shock would do to the value.
Where it appears and the workflow #
Sign in and open Portfolio, then Action Center (/Portfolio/ActionCenter). Choose a portfolio and press Refresh analysis. The bias card lists the top holdings, sector tilt and currency tilt with watch flags. In Target allocation and drift, type a target percentage for a holding and save it with the tick; the Gap column shows current weight minus target and the Indicative value column shows the amount that would close that gap. The attribution card splits invested value, market value and P&L by holding, sector and currency. In the stress card, enter a whole-market shock, a non-INR currency shock and an optional exact sector name and shock, then Run scenario. The Scenario Explorer takes a horizon (20, 60, 120 or 252 sessions), a path count (500, 2,000 or 5,000), a block length and a seed. The allocation lab takes a lookback (252 to 1,260 sessions) and a maximum research weight.
Calculation or source #
Weights use the latest stored close and convert other currencies to INR where a synced FX rate exists. Drift is current weight minus target; the indicative value is total value times target minus the holding's value. Attribution runs from recorded average cost to the latest stored close. The stress what-if adds the entered market, FX, sector and symbol shocks to each position. The Scenario Explorer resamples blocks of synchronized stored daily returns, so the same seed reproduces the same paths. The allocation lab compares, per currency group, the current allocation with equal weight, inverse training volatility, constrained minimum training variance, hierarchical risk parity and minimum historical 95% CVaR, fitted on the older 70% of the window and described on the newer held-out part.
Prerequisites, inputs, period and unit #
You need an account and at least one holding. Bias, drift, attribution and the stress what-if are available on every plan; saving targets, the Scenario Explorer and the allocation lab need Pro. Targets are percentages from 0 to 100. The Scenario Explorer needs at least 80 stored closes per holding, 60 synchronized returns and 60% of portfolio value covered; the allocation lab needs at least 90 synchronized returns per currency group and uses up to 12 holdings per group.
Worked example #
Illustrative only: a portfolio worth INR 10,00,000 holds one stock worth INR 3,00,000 (30%). With a target of 25%, the gap is +5 points and the indicative value is to reduce by INR 50,000. A -10% whole-market stress on the same portfolio shows an estimated impact of about INR -1,00,000 before any sector or currency shock.
What high and low mean #
A large positive gap means the holding is above its target weight; a large negative gap means it is below. In the Scenario Explorer, a wide band between the 5th and 95th percentile means the resampled history was volatile, not that a large move is expected.
Positive, negative and zero #
Gaps within half a point show as Within target. Negative P&L means the latest close is below recorded average cost. The stress impact keeps the sign of the shocks entered; a zero shock gives zero impact.
Limitations and common mistakes #
Suggested values ignore taxes, fees, lot sizes and market impact. Attribution is not time-weighted performance and leaves out realized sales and dividends. The stress what-if does not model correlations, volatility changes or liquidity. Resampled path frequencies describe past returns, not future probabilities, and an allocation that did well on the held-out window can do worse on the next one.
Market-specific differences #
Values are shown in INR. Each currency group in the allocation lab is analysed separately, so USD and INR listings are never mixed into one optimisation.
Suggested next steps #
Set targets for your three largest holdings so they total less than 100%, run a -10% market stress, then run the allocation lab and compare the held-out drawdown of the current allocation with equal weight.
Educational use only #
This guide explains descriptive research evidence. It is not investment advice, a price prediction, a recommendation, a claim of predictive accuracy, or an instruction to buy, sell, rebalance or place an order.