
Contents · 48 / 58
Read the Radar ML shortlist
Updated 31 October 2026 · 4 min read · 14 Contents
Plain-language meaning
The ML shortlist lists active equities on an exchange with a stored model probability that the stock's 20-session return will exceed the exchange benchmark's return over the same window. It is a persisted, validated classification estimate, not an expected return or a trading instruction.
Why it is useful #
It narrows a large universe to listings where the model's evidence is strongest and shows the confidence, coverage and model version behind each row, so the estimate can be checked rather than taken on trust.
Where it appears and the workflow #
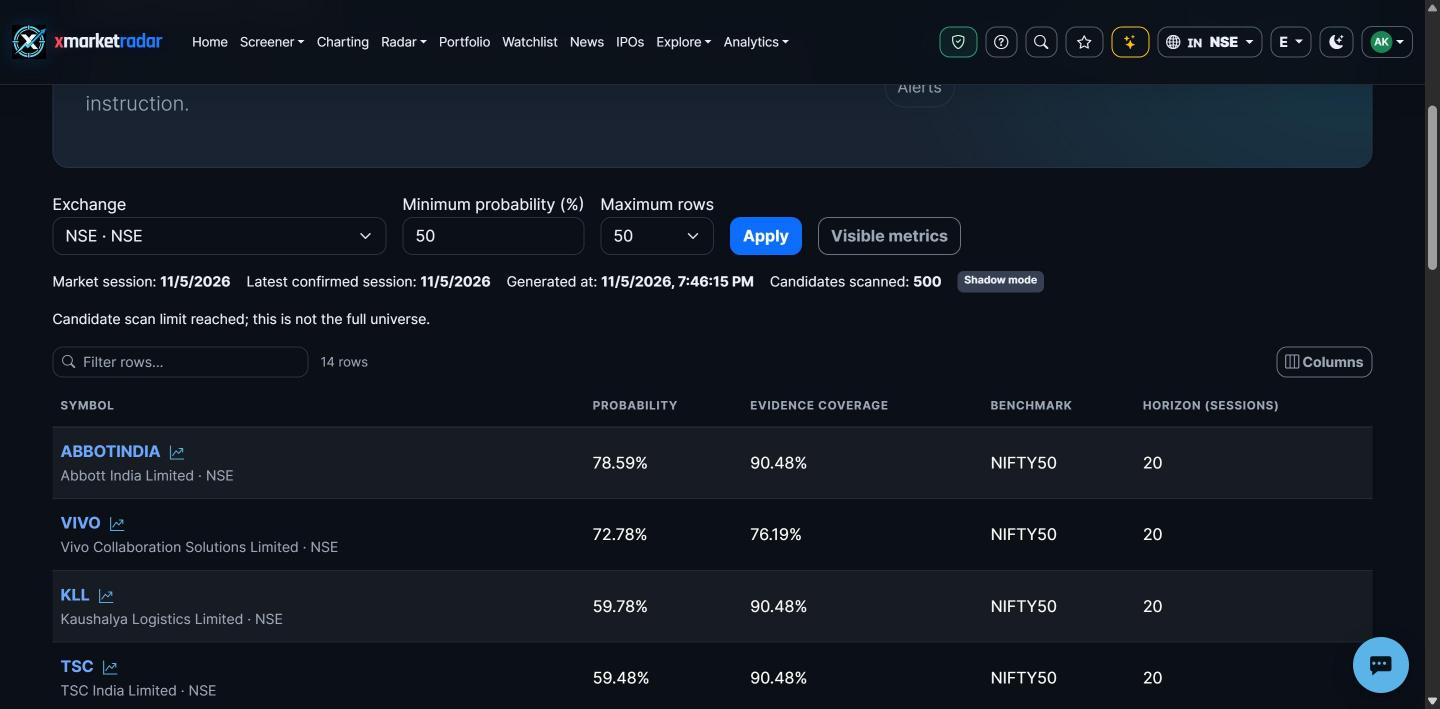
Open Radar and choose ML shortlist (/Radar/MlShortlist; on mobile the same path opens the ML shortlist screen). Choose the exchange, a minimum probability (default 50%) and up to 25, 50 or 100 rows, then Apply. The meta strip shows the market session, latest confirmed session, generated time and candidates scanned. Use Visible metrics to add evidence coverage, confidence, benchmark, horizon, model version, model engine, price source, price basis and currency; the column choice is remembered in this browser. The mobile screen also lists each row's model drivers.
Calculation or source #
The model is ml.outperformance20, an L2-regularised logistic regression with a random-forest challenger that replaces it only if it validates better. It uses 22 features (returns, RSI, ATR, volatility, volume, distance to the 20/50/200-session averages, market-regime probabilities, factor score, sector momentum, liquidity and coverage). It retrains weekly and activates a model only after walk-forward validation with at least 200 matured examples, 40 per class and three folds with a five-session gap, and only if it beats both a single-feature relative-return baseline and the base rate on Brier score and ROC AUC. Scores are read from storage; nothing is computed on request.
Prerequisites, inputs, period and unit #
Requires a signed-in Max plan (Free and Pro see a 'requires Max' banner). Coverage is 20 exchanges: NSE, BSE, NASDAQ, NYSE, AMEX, LSE, TSX, TSXV, ASX, XETRA, TSE, Euronext, Madrid, Milan, Stockholm, Copenhagen, Helsinki, Oslo, Vienna and KRX. The horizon is 20 sessions, probability is a percentage from 0 to 100, and at most 500 candidates are scanned per exchange; ETFs are excluded.
Worked example #
Illustrative only: a row showing probability 64%, confidence High and benchmark NIFTY 50 means that, among historically similar feature patterns, the model estimated a 64% chance of beating NIFTY 50 over 20 sessions. Roughly a third of such rows would still be expected to underperform.
What high and low mean #
A higher probability is a stronger modelled chance of outperforming the named benchmark, not a larger expected gain. Confidence comes from feature coverage: High at 95% or more, Medium at 85% or more and Low at 70% or more.
Positive, negative and zero #
Probabilities are never negative. 50% means the model has no edge either way. Underperformance is the complement of the probability and is not shown as a separate negative score.
Limitations and common mistakes #
Validation measures past calibration, not future performance; regime changes can weaken any model. The candidate cap means the list may not be the full universe, which the page states. A common mistake is ranking by probability and ignoring confidence, coverage and the benchmark.
Market-specific differences #
Each exchange is scored against its own benchmark and native-currency prices. The same company listed on two venues is scored separately.
Suggested next steps #
Open the shortlist for NSE at 60% minimum, add the confidence and model-version columns and record the generated time. Open one row's stock page, compare its recent return with the benchmark, and explain why a 60% probability still allows underperformance.
Educational use only #
This guide explains descriptive research evidence. It is not investment advice, a price prediction, a recommendation, a claim of predictive accuracy, or an instruction to buy, sell, rebalance or place an order.