
Contents · 15 / 18
Read the Indices board
Updated 31 October 2026 · 3 min read · 14 Contents
Plain-language meaning
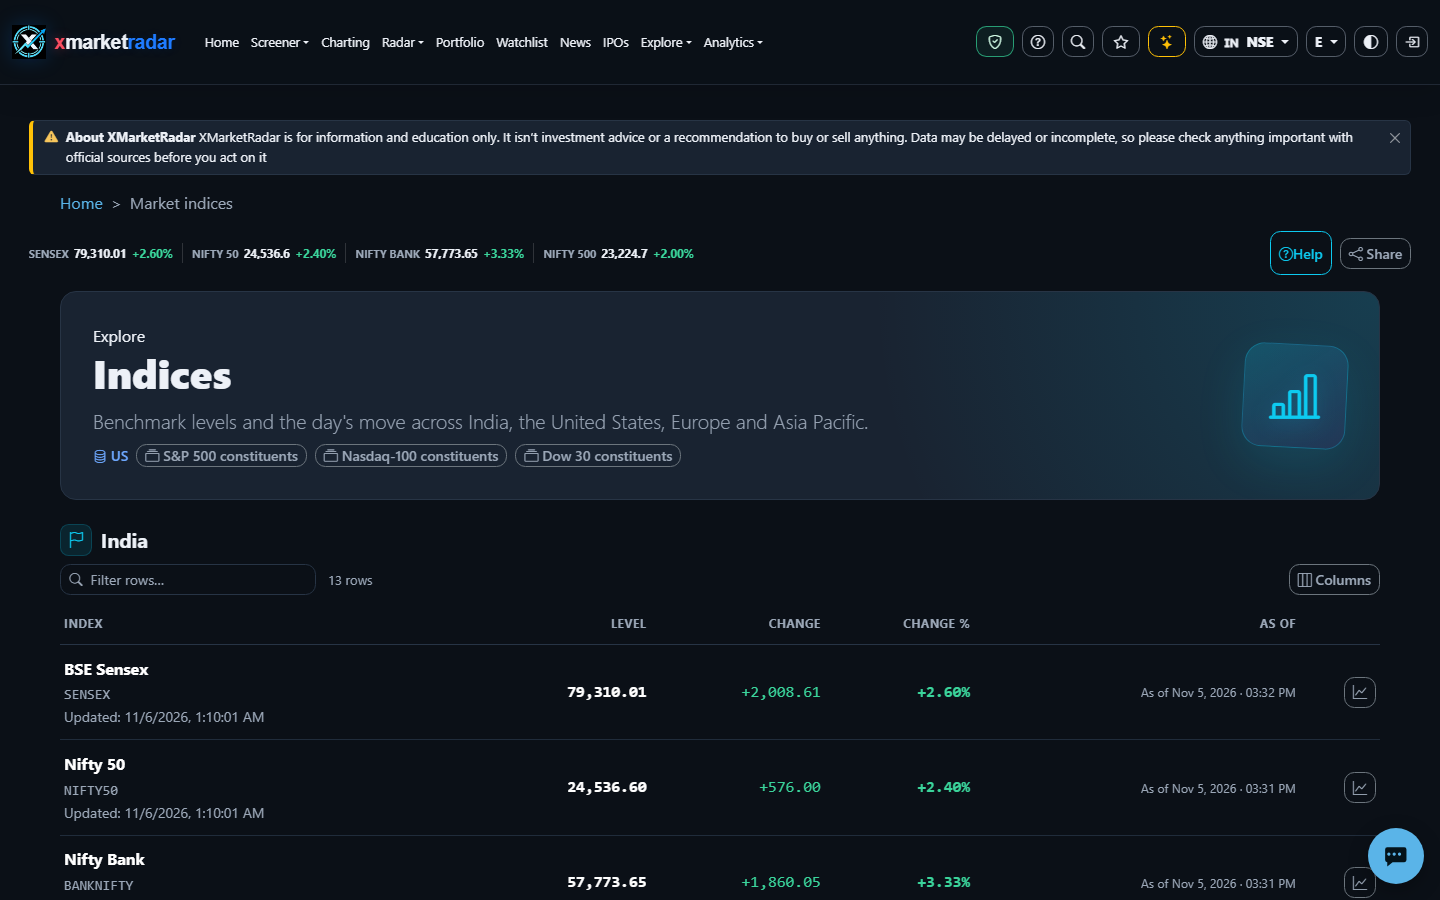
The Indices board lists benchmark index levels by region — India, United States, Europe and Asia Pacific — with the latest level, day change, percentage change and an as-of time for each row.
Why it is useful #
It gives a quick cross-market view of how major benchmarks moved before a user drills into a particular exchange or sector.
Where it appears and the workflow #
Open Indices (/indices). Each region loads on its own, so one slow region does not block the others. Read the level, change, change percentage and as-of time, and use the Chart button where one is shown. The board re-reads every 30 seconds while visible. On mobile, the dashboard's Market indices section and the index ticker show the same data for the selected exchange.
Calculation or source #
Levels come from the index quote provider with stored quotes as a fallback when the provider misses an index. For Indian indices, the day change is re-measured against the stored official NSE/BSE closes so the change uses the exchange's own previous close.
Prerequisites, inputs, period and unit #
Prerequisites are a reachable quote source for the region. Levels are index points, not currency; change is in points and percent against the previous official close.
Worked example #
Illustrative only: if an index closed at 24,000 yesterday and stands at 24,240, its change is +240 points or +1.00%. A 1% move in one index is not comparable in risk with a 1% move in an index with a different volatility history.
What high and low mean #
A higher level is not 'better' across indices because each has its own base value and base date. Only changes, not levels, are comparable between indices.
Positive, negative and zero #
Positive change means above the previous close and negative means below. Zero is a genuine unchanged level. A dash means the value is missing and is never shown as 0.
Limitations and common mistakes #
Delayed or end-of-day levels can sit next to live ones, so read each row's as-of time. Index composition, weighting and currency differ, and the board does not adjust for currency moves.
Market-specific differences #
Indian indices use NSE/BSE closes for change; other regions use the provider's previous close. Sessions open and close at different local times, so a region can show the previous day's close while another is trading.
Suggested next steps #
Open Indices and note the as-of time of one Indian and one US index. Explain why one may be live while the other is a prior close, then open the chart for an index that offers one.
Educational use only #
This guide explains descriptive research evidence. It is not investment advice, a price prediction, a recommendation, a claim of predictive accuracy, or an instruction to buy, sell, rebalance or place an order.