
Contents · 12 / 18
Read the Market Pulse summary
Updated 31 October 2026 · 4 min read · 14 Contents
Plain-language meaning
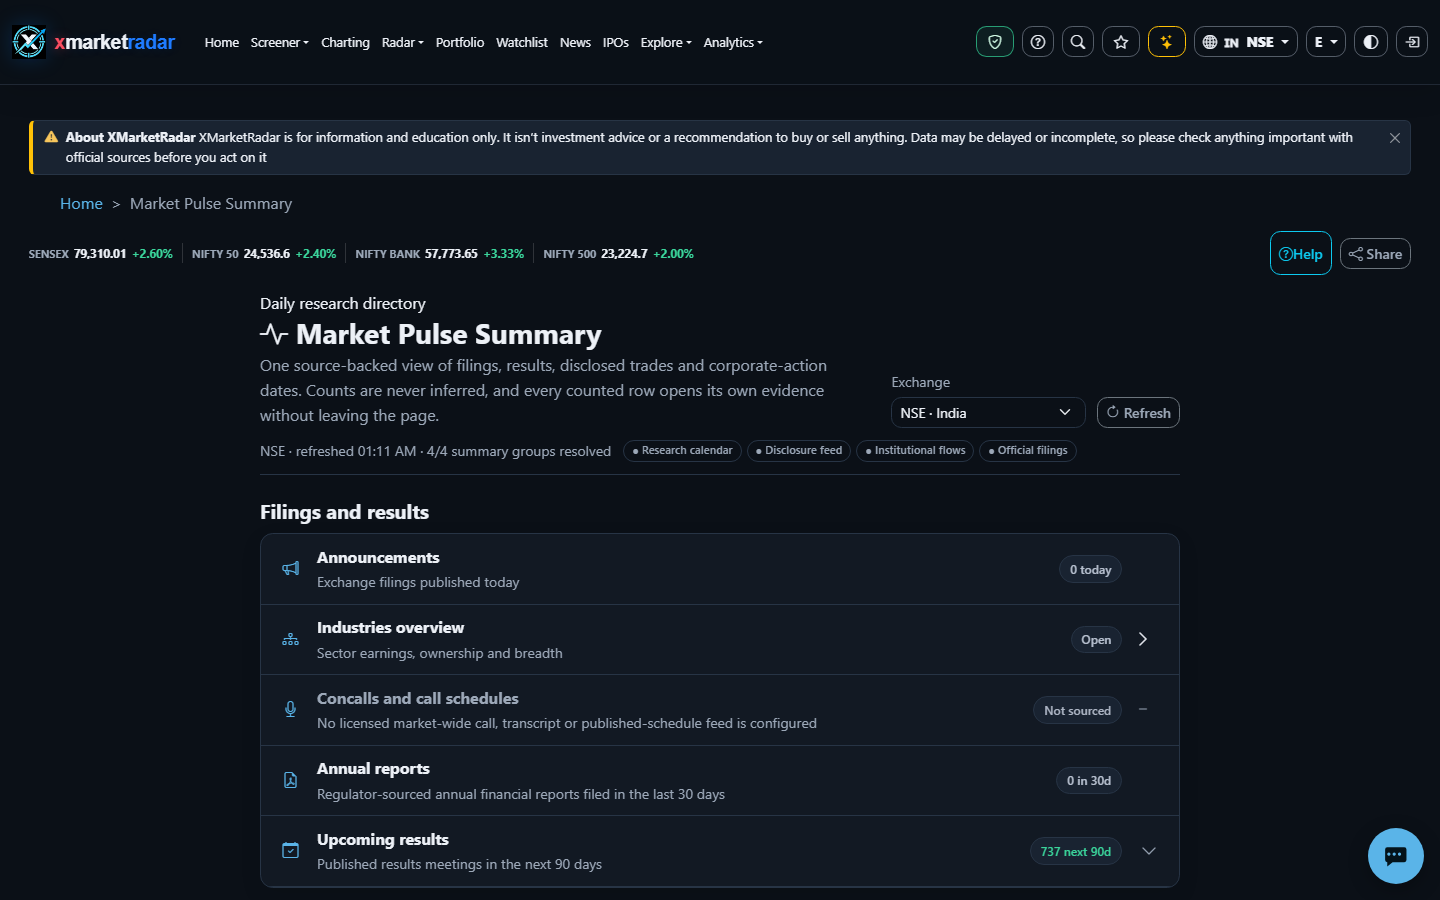
Market Pulse is a one-page count of today's disclosure activity for the selected exchange: announcements, annual reports, upcoming results, institutional flows, bulk, block, SAST and insider trades, and dividend ex-dates. Each row is a count with a preview, not a market forecast.
Why it is useful #
It answers 'what was filed or disclosed today?' in one place and links each count to the full board, so a user can decide which source to open before reading individual filings.
Where it appears and the workflow #
Open Market Pulse from the Markets menu (/MarketPulse), choose the exchange and read the status line, which shows the refresh time and how many of the four summary groups resolved. Four health chips report the research calendar, disclosure feed, institutional flows and official filings. Expand a row's chevron to preview up to six items and follow 'View all' for the complete list. The page refreshes quietly every five minutes.
Calculation or source #
Counts are read from the persisted research calendar (filings, results and dividend ex-dates), the corporate filing feed, the stored FII/FPI and DII activity history and company-intelligence events. The flow badge shows the latest session's net bought or sold value in INR crore; the flow preview shows the last 12 sessions, their total net value and the number of net-buying and net-selling days.
Prerequisites, inputs, period and unit #
Prerequisites are a supported exchange and synced source tables. Announcements and trades count today's disclosures, annual reports cover the last 30 days, and upcoming results and dividend ex-dates cover the next 90 days. Institutional flow values are INR crore for the latest stated session date.
Worked example #
Illustrative only: with NSE selected the page may show 'Announcements 214 today', 'Bulk deals 0 today' and 'FII/FPI Net sold ₹1,250 Cr'. The bulk-deal zero is a real zero for today's disclosures, while the net-sold badge describes one session and does not say where prices go next.
What high and low mean #
A higher count means more disclosures of that type in the stated window. A count prefixed with ≥ reached the read cap (1,000 calendar rows or 500 deals) and is a lower bound. Large disclosure counts are common around results seasons and are not a sentiment measure.
Positive, negative and zero #
Zero is shown as '0 today' and means the source was read and nothing qualified. Net bought is a positive institutional net value and net sold a negative one for that session only; neither is a recommendation.
Limitations and common mistakes #
Counts are not deduplicated across sources and do not judge materiality. The bonus, rights, splits and buybacks row is a symbol lookup, not a count. Common mistakes are reading a capped ≥ count as exact or treating one session's institutional net value as a trend.
Market-specific differences #
Coverage is richest for NSE and BSE because the Indian disclosure, deal and institutional-flow sources are persisted there. Other exchanges show the groups that have sources and label the rest honestly instead of borrowing Indian figures.
Suggested next steps #
Open Market Pulse for NSE, note which groups resolved and expand one non-zero row. Follow 'View all' to its board, confirm the source date, then switch to a non-Indian exchange and explain why some rows change to 'India only' or 'Not covered'.
Educational use only #
This guide explains descriptive research evidence. It is not investment advice, a price prediction, a recommendation, a claim of predictive accuracy, or an instruction to buy, sell, rebalance or place an order.