
Contents · 13 / 18
Use the Market Activity boards
Updated 31 October 2026 · 4 min read · 14 Contents
Plain-language meaning
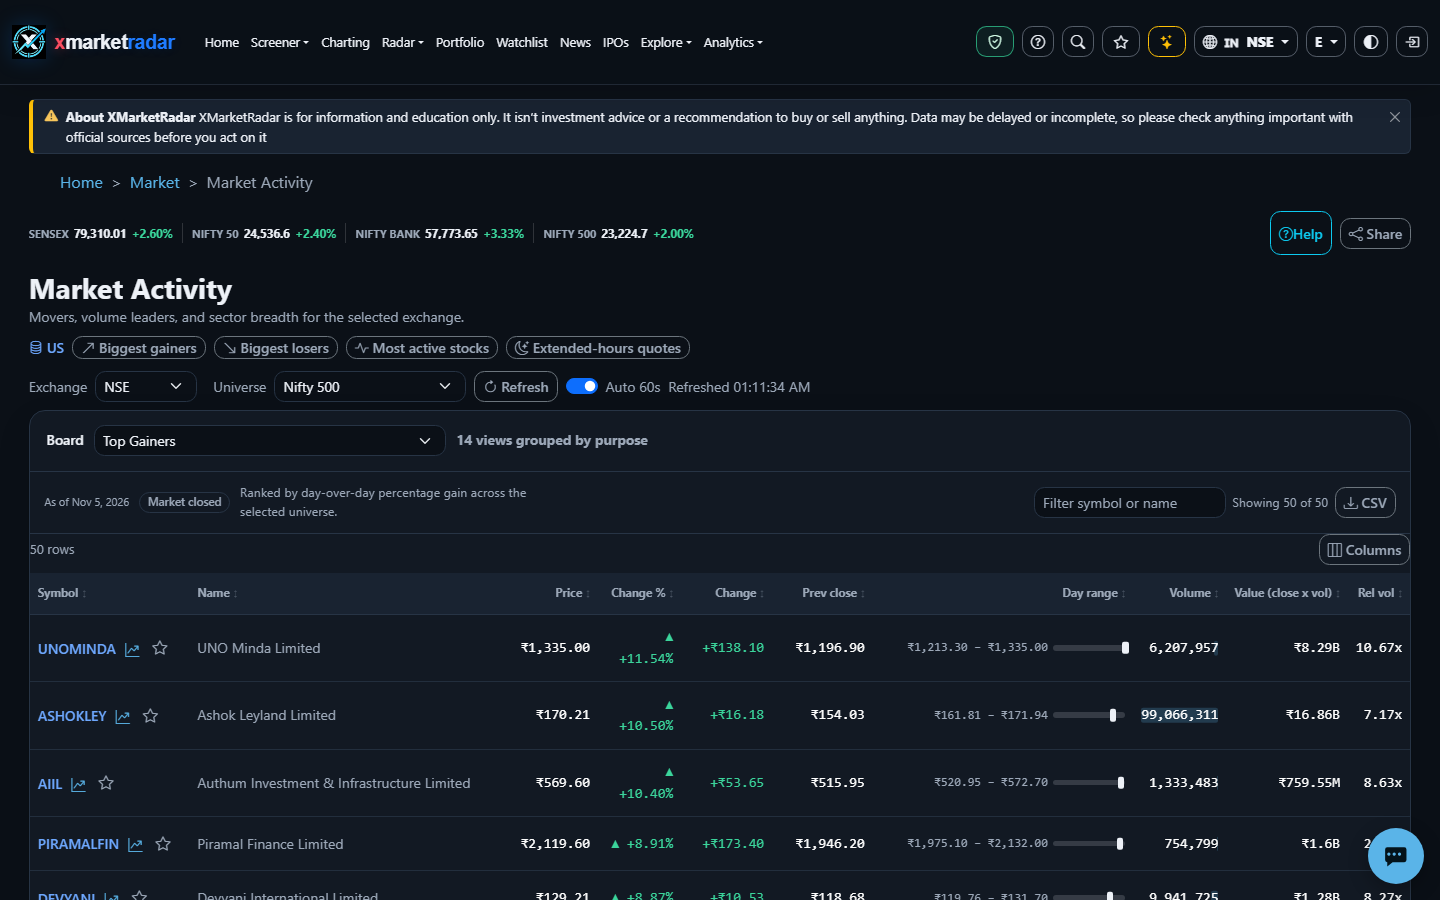
Market Activity groups the session's movers into boards for an exchange and universe: top gainers and losers, most traded, high-volume movers, 52-week highs and lows, price and volume shockers, circuit watch, sector heatmap and breadth, and turnover. Every board describes what already happened in the session.
Why it is useful #
It lets a user scan one exact universe, such as Nifty 500 or the S&P 500, for unusual moves and turnover without building a screen, then open the listing to inspect the evidence behind a move.
Where it appears and the workflow #
Open Market Activity (/market/activity), choose the exchange (NSE, BSE, NASDAQ, NYSE, AMEX, HKEX or SGX) and universe, then pick a board. Each board has a symbol or name filter, a 'Showing x of y' count, CSV export and click-to-sort columns. Sector tiles and breadth rows open a detail panel. Auto-refresh every 60 seconds is on by default and skips reloads while the market is closed. Turnover has its own market, segment, daily or monthly, and 30/90/365-day controls with numbered source links.
Calculation or source #
Rows are built from persisted session bars for the selected universe. Relative volume is session volume divided by the trailing 20-session average volume. Distance below the 52-week high is (52W high − close) ÷ 52W high × 100 and distance above the 52-week low is (close − 52W low) ÷ 52W low × 100. Price shockers rank by the absolute change percentage, and value traded is close × volume.
Prerequisites, inputs, period and unit #
Prerequisites are a supported exchange and a universe that has stored bars for the session. Prices are in the venue's native currency, change is in percent and price units, volume is shares, and the 52-week and relative-volume figures need enough history; rows without it are unavailable.
Worked example #
Illustrative only: a listing closing at 105 with a 52-week high of 120 is 12.5% below its high. If it traded 3.0 million shares against a 20-session average of 1.2 million, its relative volume is 2.5×. Both describe the session; neither says the move will continue.
What high and low mean #
A high relative volume means the session was busier than its own recent average, and a listing near its 52-week high has traded close to the top of its one-year range. Sector breadth shows how many constituents rose or fell, not how much money moved.
Positive, negative and zero #
Positive change means the close is above the previous close and negative means below. A zero change is a real unchanged close. Gainers and losers are relative to the previous session only and are not ranked by quality.
Limitations and common mistakes #
Boards rank by one measure and ignore liquidity, news and corporate actions, so a thin listing can top a shockers board on a small trade. The universe filter does not apply to Turnover. HKEX and SGX prices show a dash when the venue currency symbol is unknown. A common mistake is comparing a gainer on one exchange with a gainer from another universe.
Market-specific differences #
NSE and BSE offer index universes such as Nifty and SENSEX families, while US venues offer Nasdaq-100, S&P 500 and Dow 30 filtered to the selected venue's listings. Session timing and holidays follow each exchange's own calendar.
Suggested next steps #
Choose NSE and the Nifty 500, open High Volume Movers and record the top relative-volume row. Open its Market Details page, check the session date and news, then compare the same listing's position on the 52W High board and explain what each board measures.
Educational use only #
This guide explains descriptive research evidence. It is not investment advice, a price prediction, a recommendation, a claim of predictive accuracy, or an instruction to buy, sell, rebalance or place an order.