
Contents · 9 / 11
Build a screener dashboard
Updated 31 October 2026 · 3 min read · 14 Contents
Plain-language meaning
A screener dashboard pins up to six of your saved screeners as cards and re-runs them together, so several rule sets can be monitored on one screen against stored market data.
Why it is useful #
It saves opening each screen separately and shows, card by card, how many listings matched, how many were evaluated and how fresh the data was.
Where it appears and the workflow #
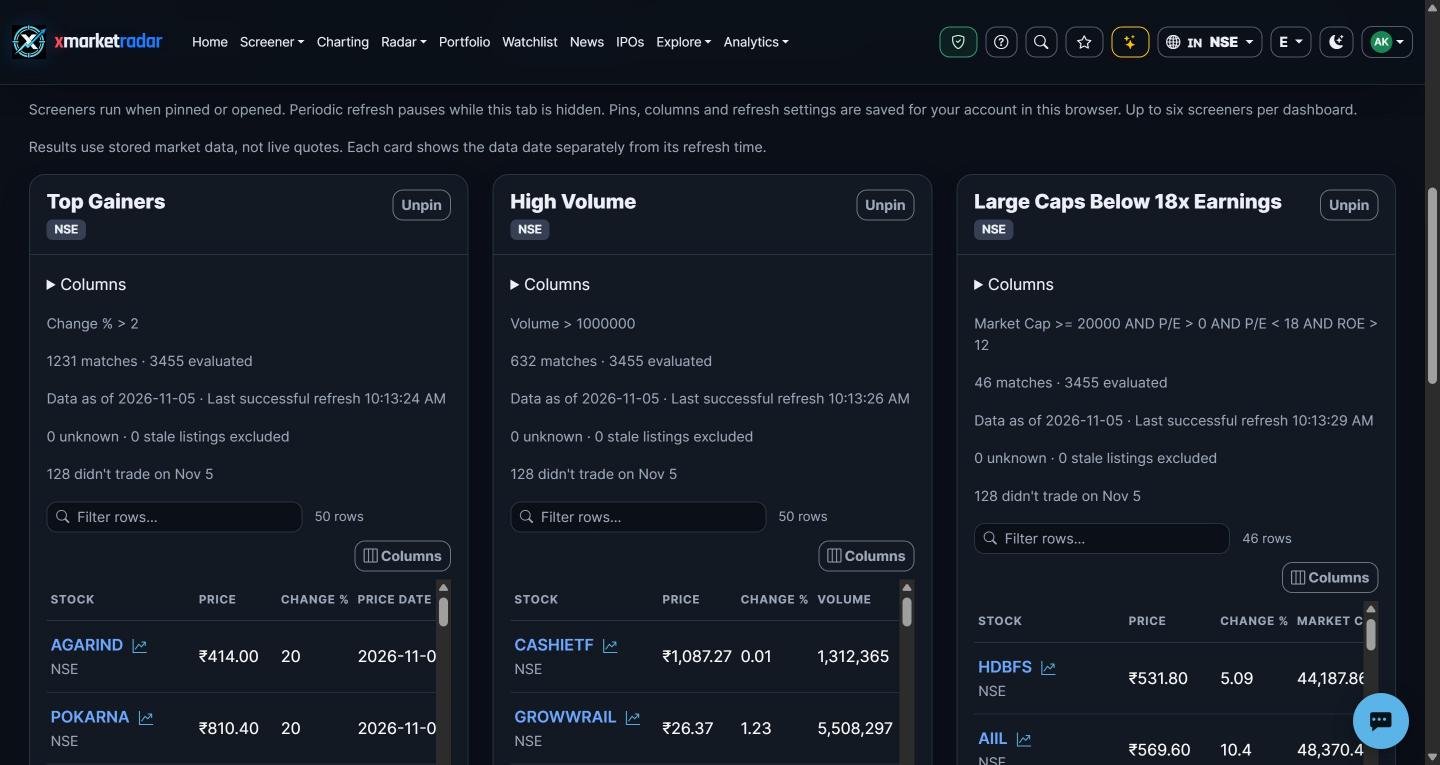
Open Screener and choose Dashboard (/screeners/dashboard; on mobile the screener dashboard screen). Name a dashboard, choose a saved screener and Pin it (up to six per dashboard), then use Refresh all or set periodic refresh to 1, 5, 15 or 30 minutes; it pauses while the tab is hidden. Set cards per row or use Full screen. Each card shows its query, match count, data date, last successful refresh, excluded unknown or stale listings, a columns picker, up to 50 rows with a chart peek, and Refresh, Edit query, Save as and All results actions. A read-only link to one dashboard opens it with an Edit dashboard button.
Calculation or source #
Saved screeners come from your account; each card runs the normal screener against persisted market data, not live quotes. The dashboard layout and pins are stored in this browser (or on the device in the mobile app), not on the server.
Prerequisites, inputs, period and unit #
Prerequisites are sign-in and at least one saved screener. Field access follows the screener plan tiers: some fields require Pro, and research and ML fields require Max. Each card uses its saved screener's exchange or All exchanges.
Worked example #
Illustrative only: pinning 'NSE momentum' and 'US value' could show '42 matches · 498 evaluated' and '7 matches · 503 evaluated' with different data dates. The counts answer two different rule sets and are not comparable as scores.
What high and low mean #
A higher match count means more listings passed that card's rules; it says nothing about whether the rules are useful. Excluded unknown or stale listings reduce the evaluated count.
Positive, negative and zero #
Zero matches is a real result: no listing passed the rules in the available data. A negative change in match count between refreshes means fewer listings now qualify, not a market decline.
Limitations and common mistakes #
Dashboards do not sync across browsers or devices. Frequent refresh does not make data newer than its stored session. A common mistake is reading a card's matches as a ranked recommendation.
Market-specific differences #
Exchanges keep their own sessions and data dates, so cards for different markets can show different 'Data as of' dates at the same time.
Suggested next steps #
Pin two saved screeners for different exchanges, refresh both and record each card's data date and evaluated count. Edit one query, Save as a new screener, pin it and explain the change in matches.
Educational use only #
This guide explains descriptive research evidence. It is not investment advice, a price prediction, a recommendation, a claim of predictive accuracy, or an instruction to buy, sell, rebalance or place an order.