
ਵਿਸ਼ਾ-ਸੂਚੀ · 7 / 13
Allocation, position weights and concentration
ਅੱਪਡੇਟ 4 ਅਗਸਤ 2026 · 4 ਮਿੰਟ ਪੜ੍ਹਨ ਦਾ ਸਮਾਂ · 16 ਵਿਸ਼ਾ-ਸੂਚੀ
Explore allocation arithmetic
Change three illustrative position values. Their weights use only this stated, compatible currency-unit denominator; the result is descriptive, not an allocation recommendation.
- Position A
- 60%
- Position B
- 25%
- Position C
- 15%
- Compatible total
- 1,000 CU
ਸਰਲ ਭਾਸ਼ਾ ਵਿੱਚ ਅਰਥ
Allocation, position weights and concentration means examining owner-declared holdings, transactions, cash flows, compatible return bases and risk summaries with the identity, period, unit, source and limitations kept visible. It is a disciplined way to describe evidence, not a shortcut to an investment conclusion.
Learning objectives #
After this chapter you should be able to define allocation, position weights and concentration, identify the evidence needed to use it, distinguish a reported zero from unavailable evidence, and explain why unlike instruments or periods may not be comparable.
Prerequisites #
Read “Benchmarks and date-aligned relative performance” first. Be comfortable checking an exact listing or instrument, its source, observation date, native currency and unit. When any one of those is unknown, pause the comparison and record the gap.
Core concept #
Weights divide compatible position value by compatible portfolio value. Preserve raw facts separately from interpretation, and retain the denominator, time window, classification rule and provenance that make the evidence reproducible.
Method #
For allocation, position weights and concentration, first identify the exact evidence named in this chapter: Weights divide compatible position value by compatible portfolio value. Then freeze identity and period, collect source-backed inputs with units, calculate or classify only compatible evidence, and record contrary facts and unavailable fields.
Where it appears in XMarketRadar #
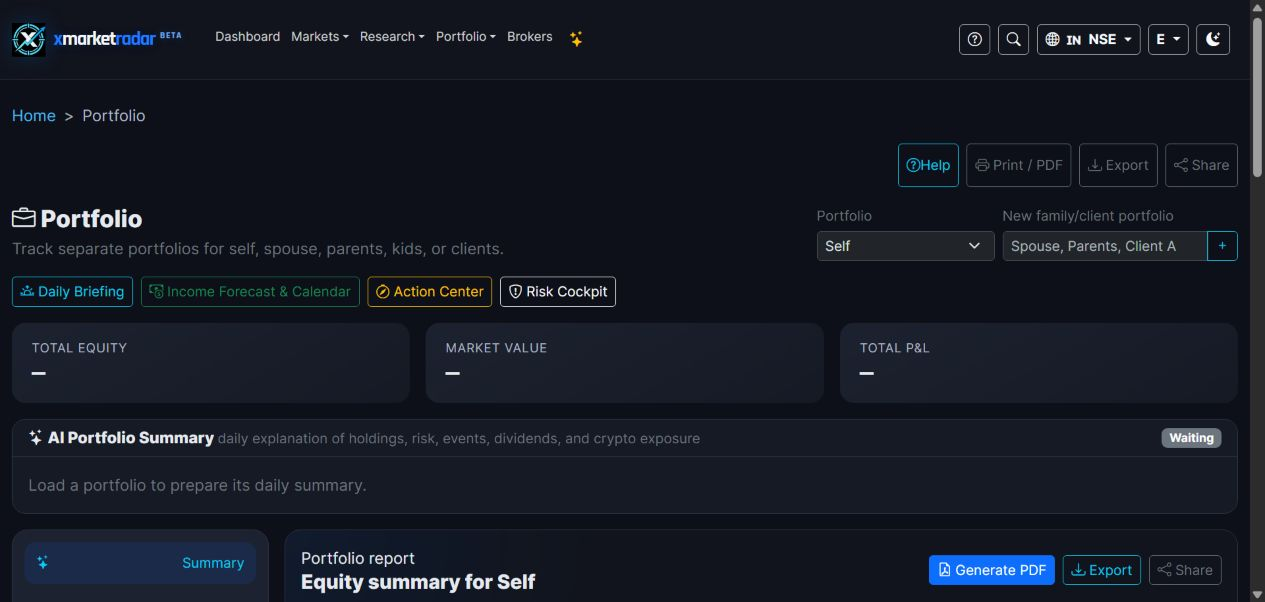
Use Portfolio Holdings, Transactions, Analytics, Risk Cockpit, X-ray, briefings and the read-only broker import workflow. A displayed field is useful only with its source and as-of context. If XMarketRadar does not calculate this chapter’s concept directly, use the chapter as an educational checklist and retain the supporting primary document or screen URL in the research workspace.
Worked example #
Positions CU 600 and CU 400 yield 60% and 40%; a USD row is excluded from an INR-only denominator. Module context: Illustrative portfolio records an external deposit of USD 1,000, then 10 shares at USD 80 plus a USD 5 fee; a later value of USD 850 separates the USD 1,000 cash flow from the -155 USD market-and-cost result. This is an illustrative audit trail, not live data, a target or an expected outcome.
Interpretation #
Interpret the result in the direction defined by the field, not by an assumed desirable outcome. Higher, lower, positive and negative can each have different meanings by context. Compare the observation with its own history or a compatible benchmark, and label conclusions as observations, interpretations or user decisions.
Limitations and common mistakes #
Treating a 60% weight threshold as an automatic rebalance instruction. Missing transactions, taxes, fees, income, corporate actions, benchmark dates or FX rates can materially distort portfolio calculations. A precise calculation can still mislead when the source is stale, the denominator changed, or a classification hides important detail.
Market and jurisdiction differences #
Cost basis, tax lots, settlement and disclosures vary; native USD, INR, CAD, GBP/GBp, JPY and KRW groups remain separate unless a timestamped FX conversion is explicit. Exchange rules, accounting conventions, calendars, taxes, disclosure timing, quote scale and licensed coverage can differ. Verify the current primary source for the relevant venue; registry support alone does not prove that every field is available.
Key takeaways #
For allocation, position weights and concentration, remember this boundary: Treating a 60% weight threshold as an automatic rebalance instruction. Keep the evidence exact, dated and source-backed; publish missing information as unavailable rather than manufacturing a value.
Practice #
Reproduce this historical scenario from source-labelled inputs: Positions CU 600 and CU 400 yield 60% and 40%; a USD row is excluded from an INR-only denominator. Then change one input, preserve the original period and unit, and explain whether the result changes or becomes unavailable. Write the identity, source, date, unit and failure condition, then state exactly what would display as —.
Knowledge check #
ਜਵਾਬ ਅਤੇ ਵਿਆਖਿਆ ਦਿਖਾਓ
Question: which mistake would invalidate a review of allocation, position weights and concentration? Answer: Treating a 60% weight threshold as an automatic rebalance instruction. Explanation: the chapter requires the stated identity, period, unit and compatible evidence; a missing required input remains — rather than 0.
Educational use only #
This chapter is descriptive education, not investment advice, a forecast, a recommendation, a suitability assessment or an instruction to buy, sell, rebalance, trade or place an order. XMarketRadar’s broker connections remain read-only.